Time-series data from the AVEVA PI System turns a multi-building campus into one connected, data-driven environment, cutting energy costs and giving your team the information to act on.
Smart Campus connects the sensors and systems already running across your buildings, smart meters, environmental sensors, HVAC controls, and lighting, into a single AVEVA PI System. Once that data lands in one place, WatchPost can analyze it, visualize it, and put it in front of the people who need to act on it.
Getting there takes a few deliberate steps: ingesting data from BACnet and Modbus devices, building an asset framework that follows the Haystack Schema (ASHRAE 223) so information stays organized by building, system, and equipment type, and cleaning the data so gaps or bad readings don't throw off the analysis.
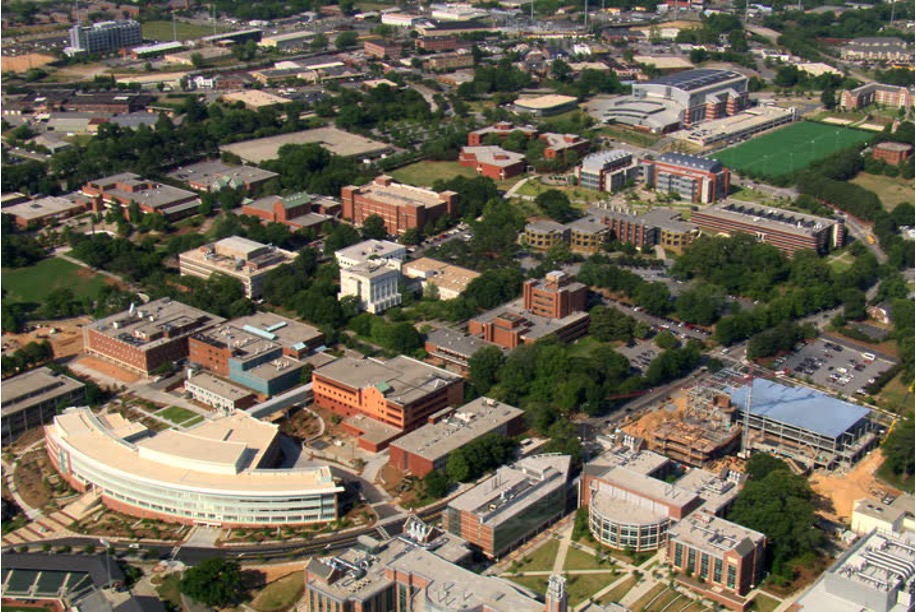
A multi-building campus like this is exactly what Smart Campus is built to unify, one platform pulling in data from every building on the grounds.
Real-time electricity, gas, chilled water, and water consumption data, the foundation everything else is built on.
Temperature, humidity, air quality, and occupancy data that helps WatchPost forecast and plan energy savings.
Performance data pulled straight from your building automation system, centralized for analytics and visualization.
Occupancy and usage data that flags when HVAC is running in spaces nobody's using.
The asset framework is what sets WatchPost apart. Structuring data by building, system, and equipment type is what makes both analytics and visualization possible, not just one or the other.
With insights from the PI System and predictive analytics, you can make data-driven decisions instead of running every zone on the same fixed schedule:
The result is a campus, center, or site that runs on data instead of guesswork, and one that saves money while supporting sustainability and net-zero goals.
Schedule a demo and DSA's WatchPost team will walk through what a real-time view of your campus could look like.