Built to Remove the Blind Spots in Your Facility
Each solution below plugs into the systems your team already runs. Pick one to start, or deploy the full platform for a complete, real-time view of your operation.
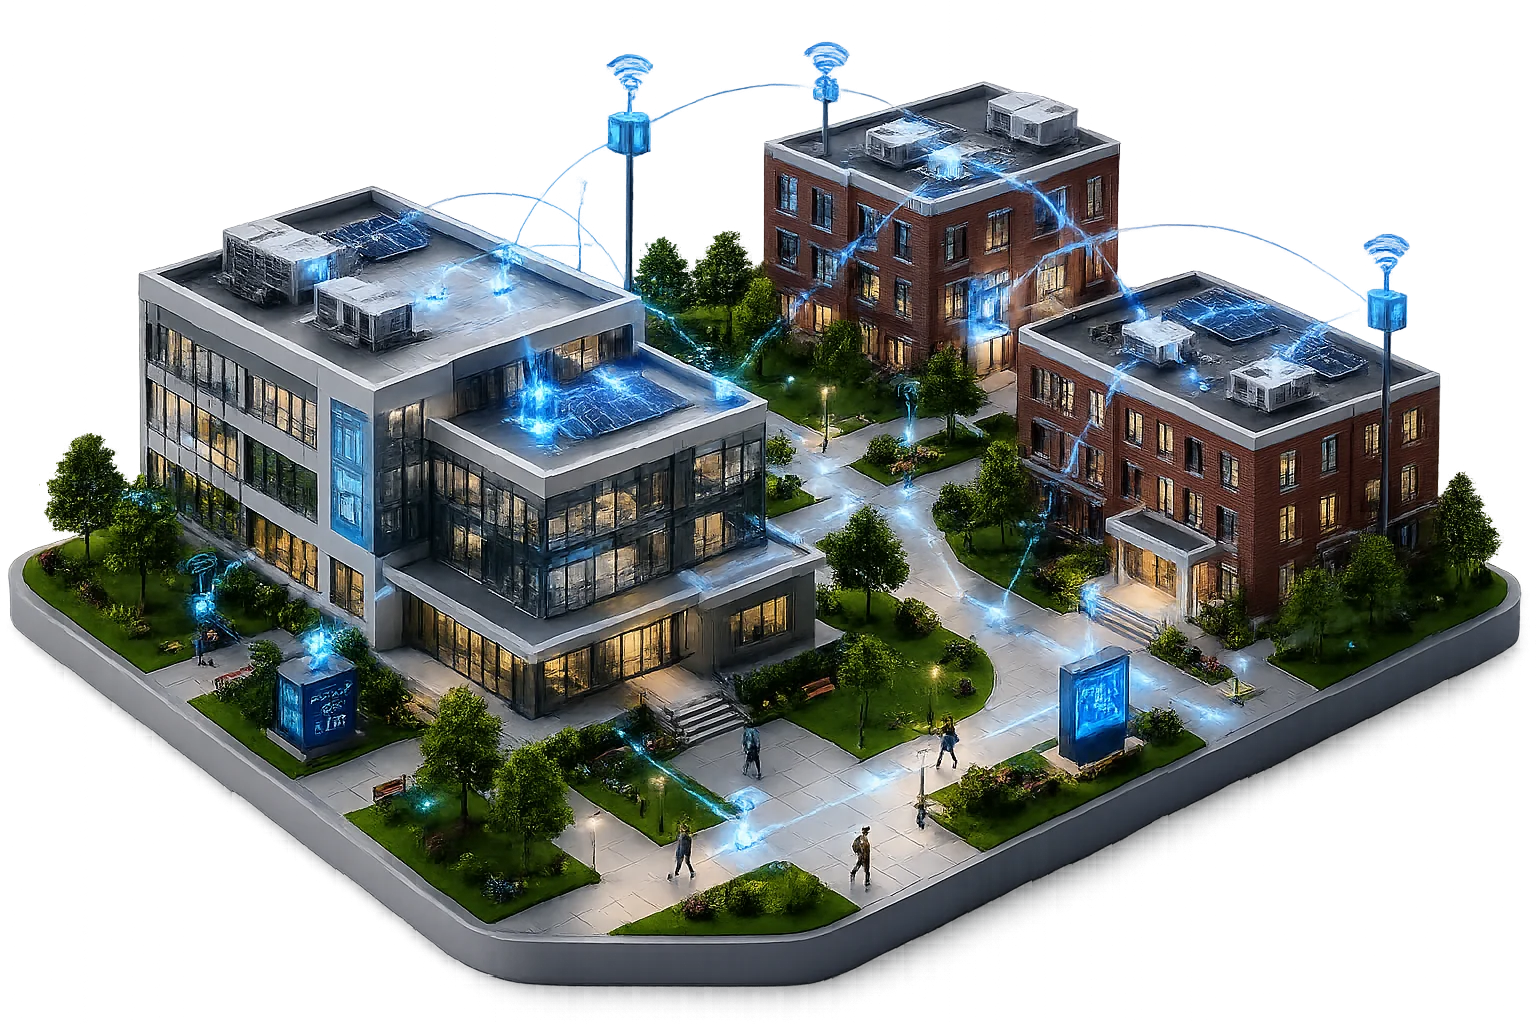
Smart Campus
Connects people, devices, and applications across every building on your campus, improving efficiency, resilience, and security in one unified view.
Learn More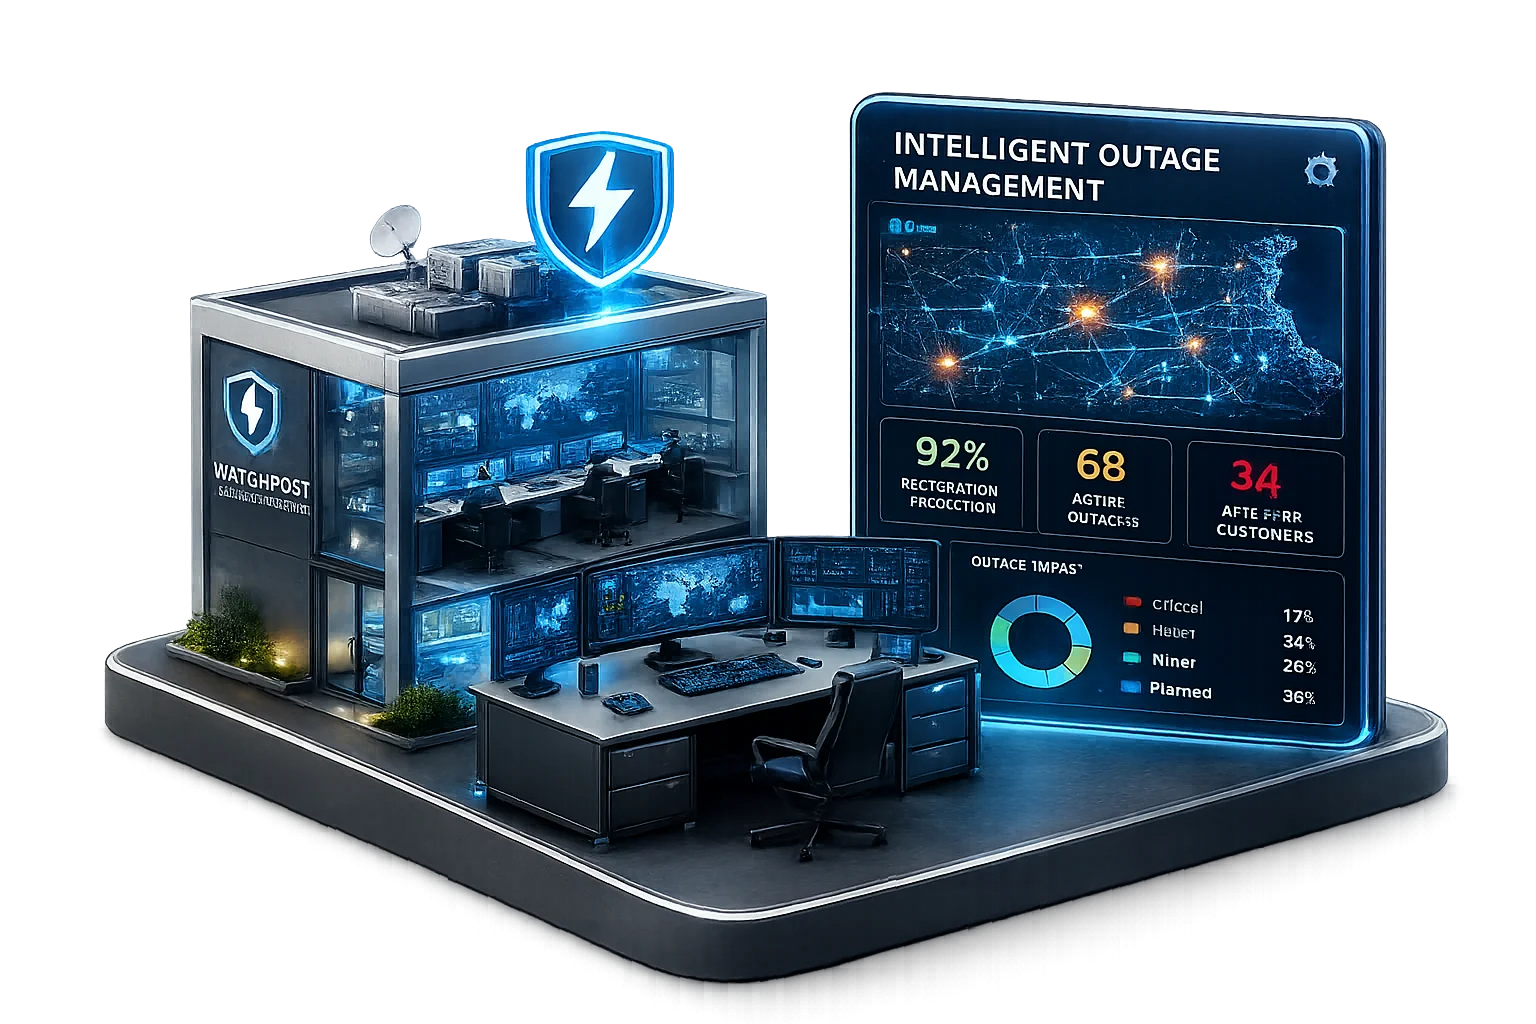
Intelligent Outage Management
Detects, analyzes, and helps you respond to power outages before they spread, using real-time grid data and automated fault correlation.
Learn More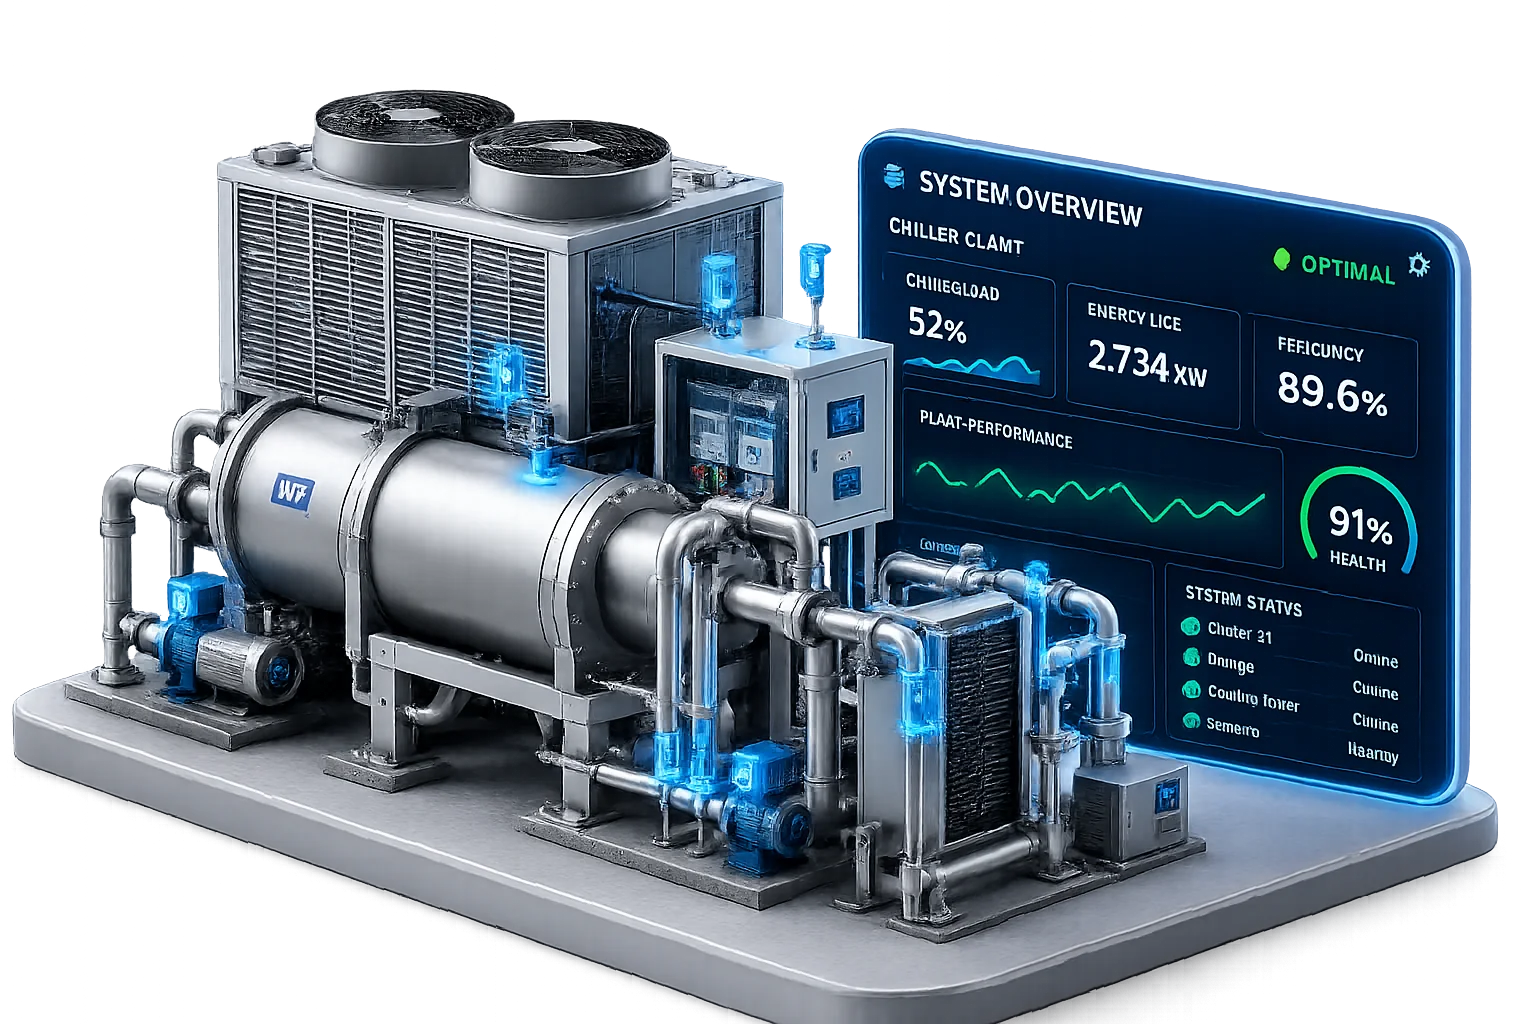
Central Plant Monitoring
Secure, remote visibility into chillers, boilers, and thermal distribution equipment, the core of situational awareness for any central plant.
Learn More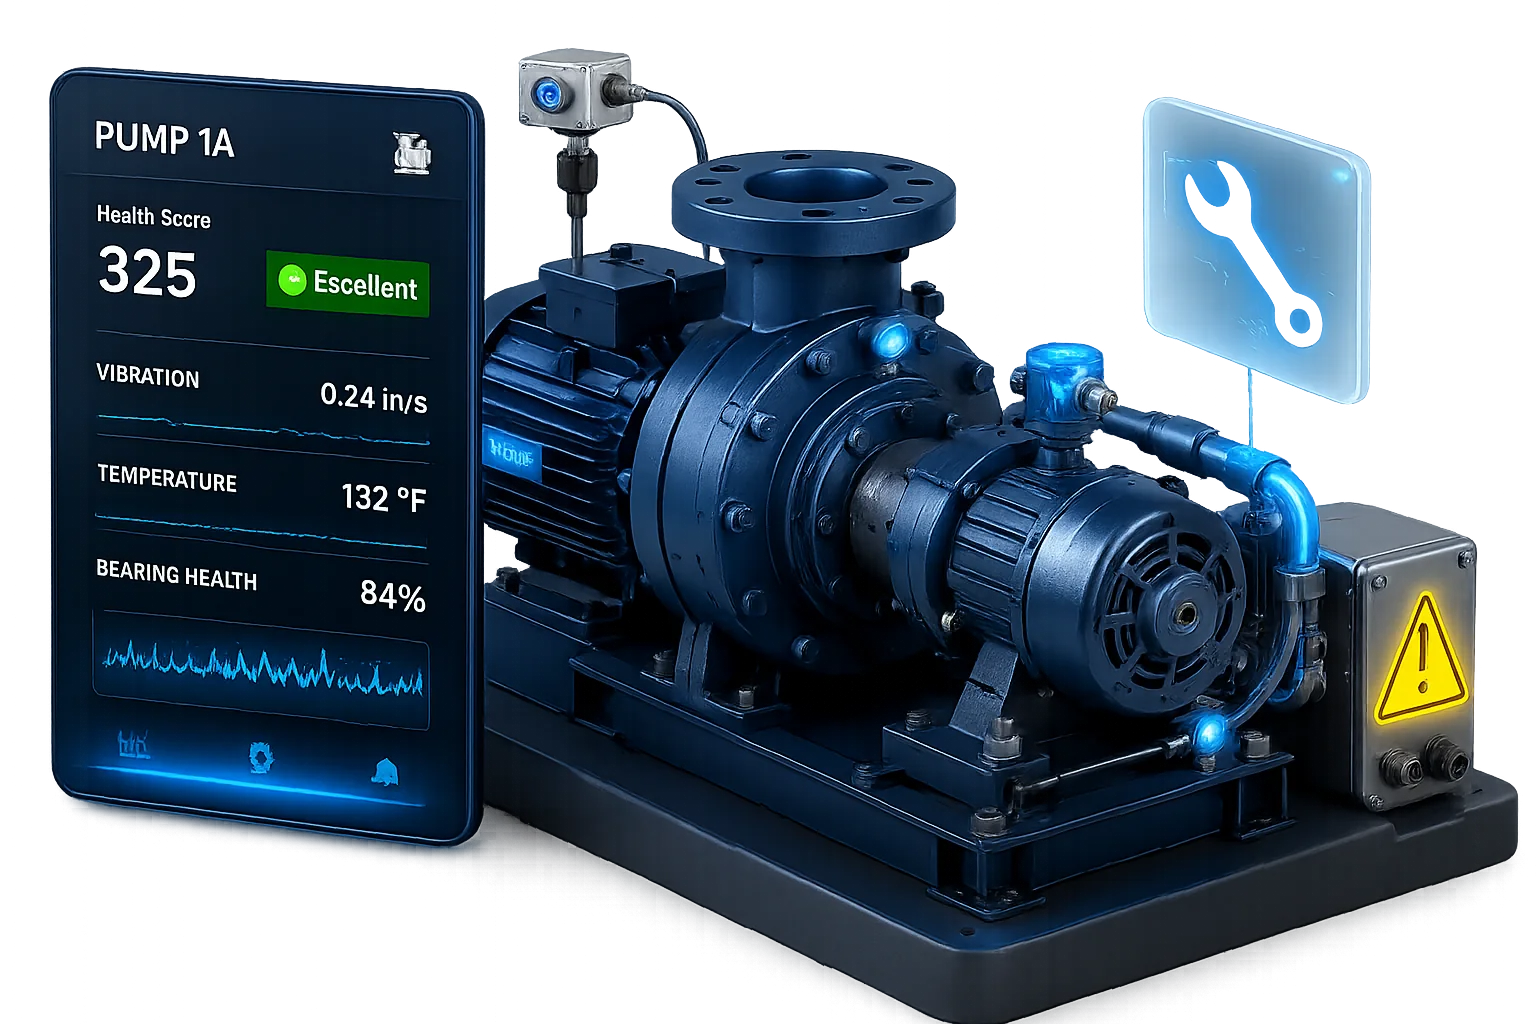
Condition-Based Maintenance
Moves maintenance from a fixed schedule to a data-driven one, using vibration and sensor data to catch problems before they cause downtime.
Learn More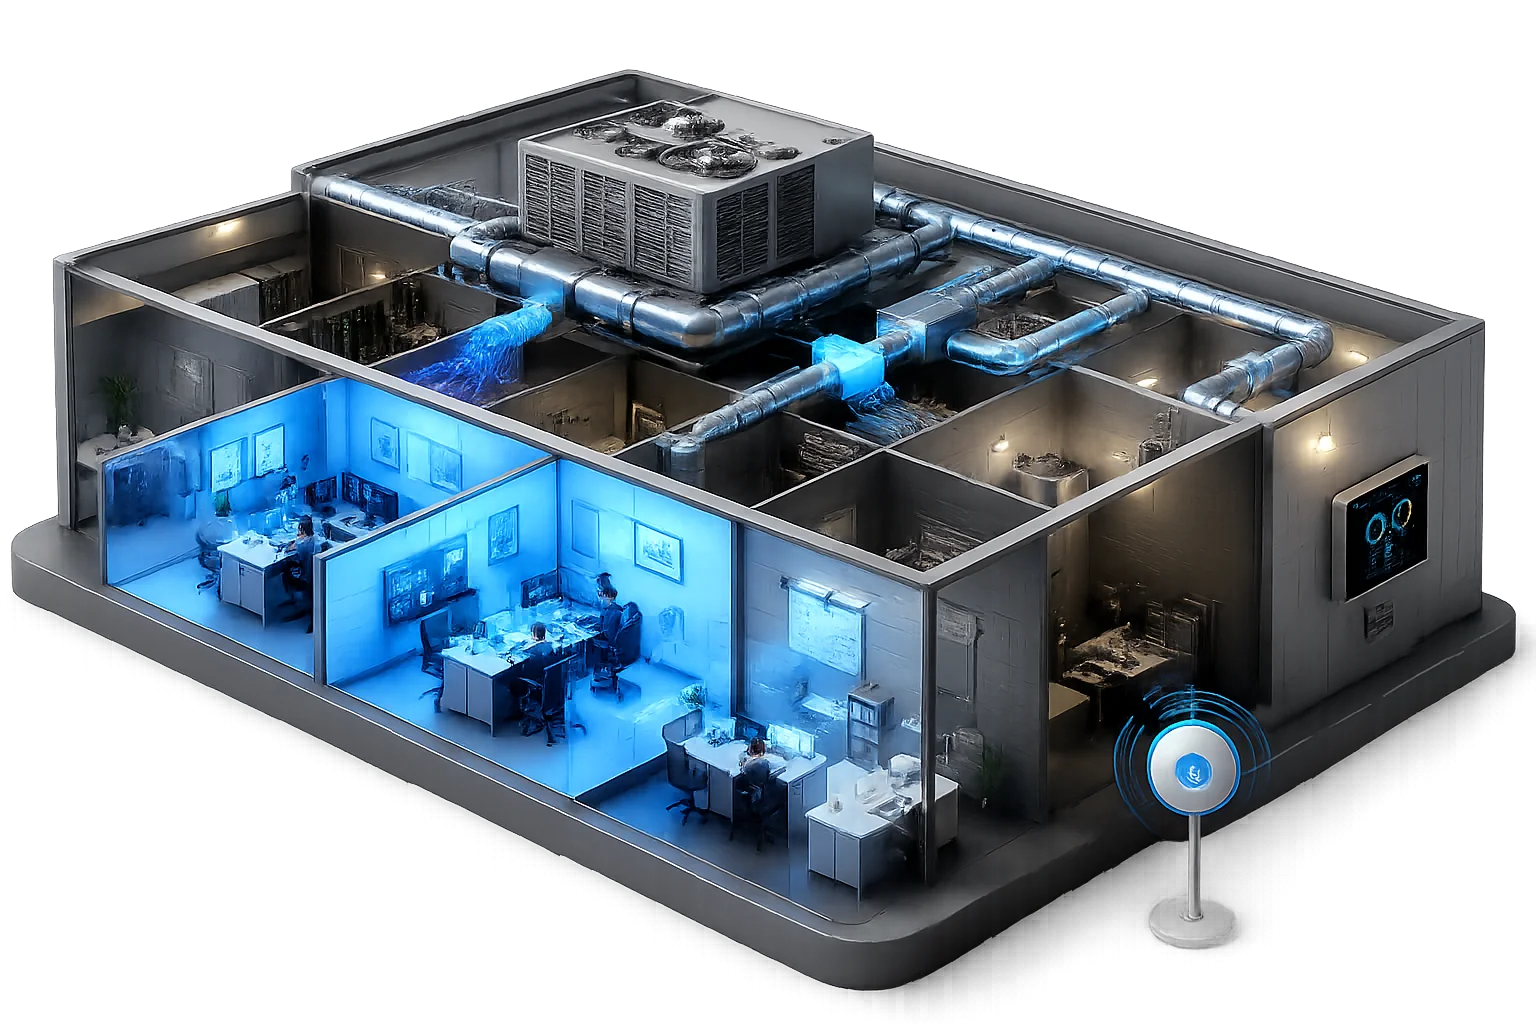
Smart HVAC Scheduling
Runs HVAC at the zone level instead of the building level, so equipment only conditions the spaces that are actually occupied.
Learn More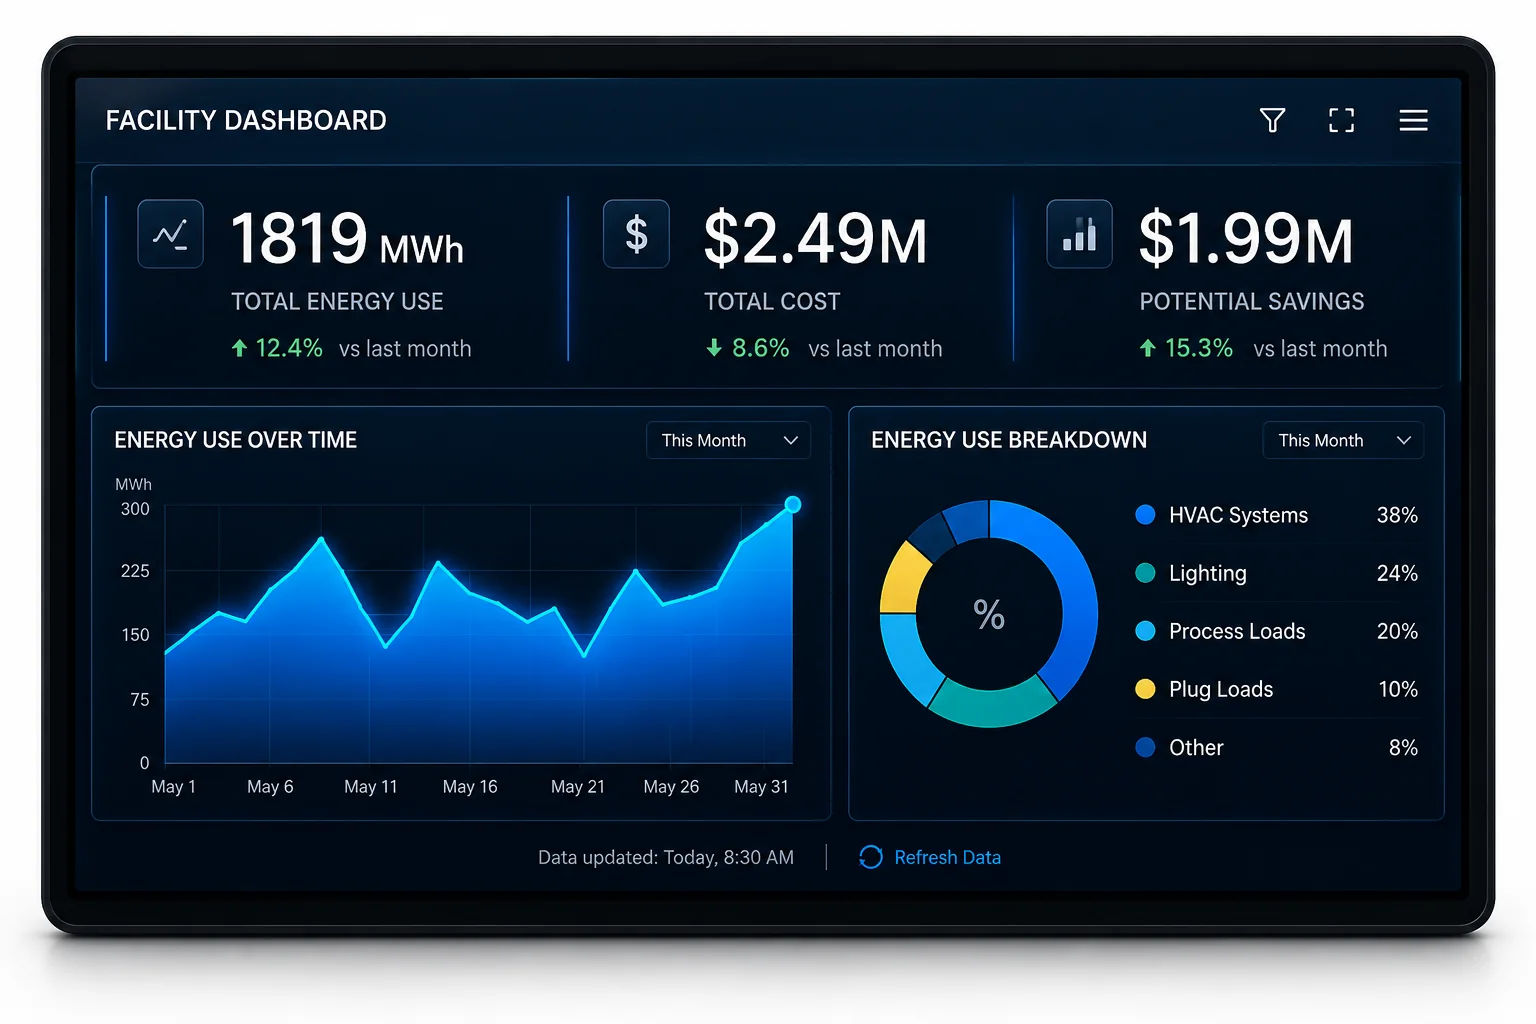
Energy Management (EMIS)
One system for tracking consumption, benchmarking performance, and finding savings opportunities across your entire portfolio.
Learn More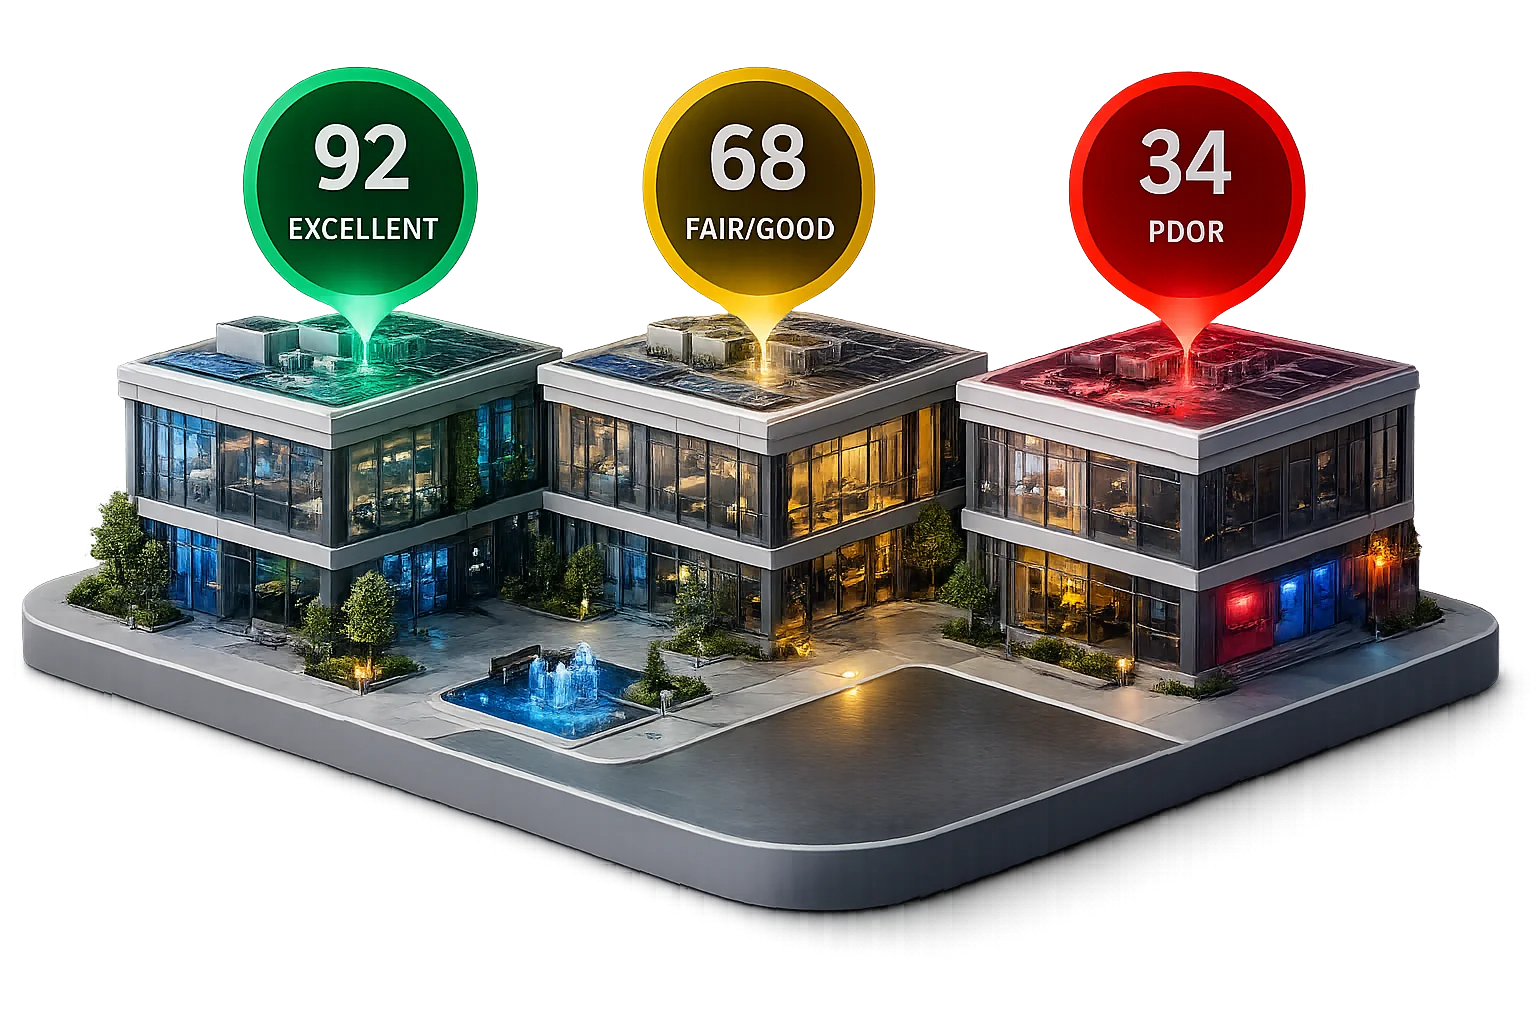
Energy Use Index
Normalizes energy performance across buildings so facilities teams, executives, and sustainability offices are all looking at the same numbers.
Learn More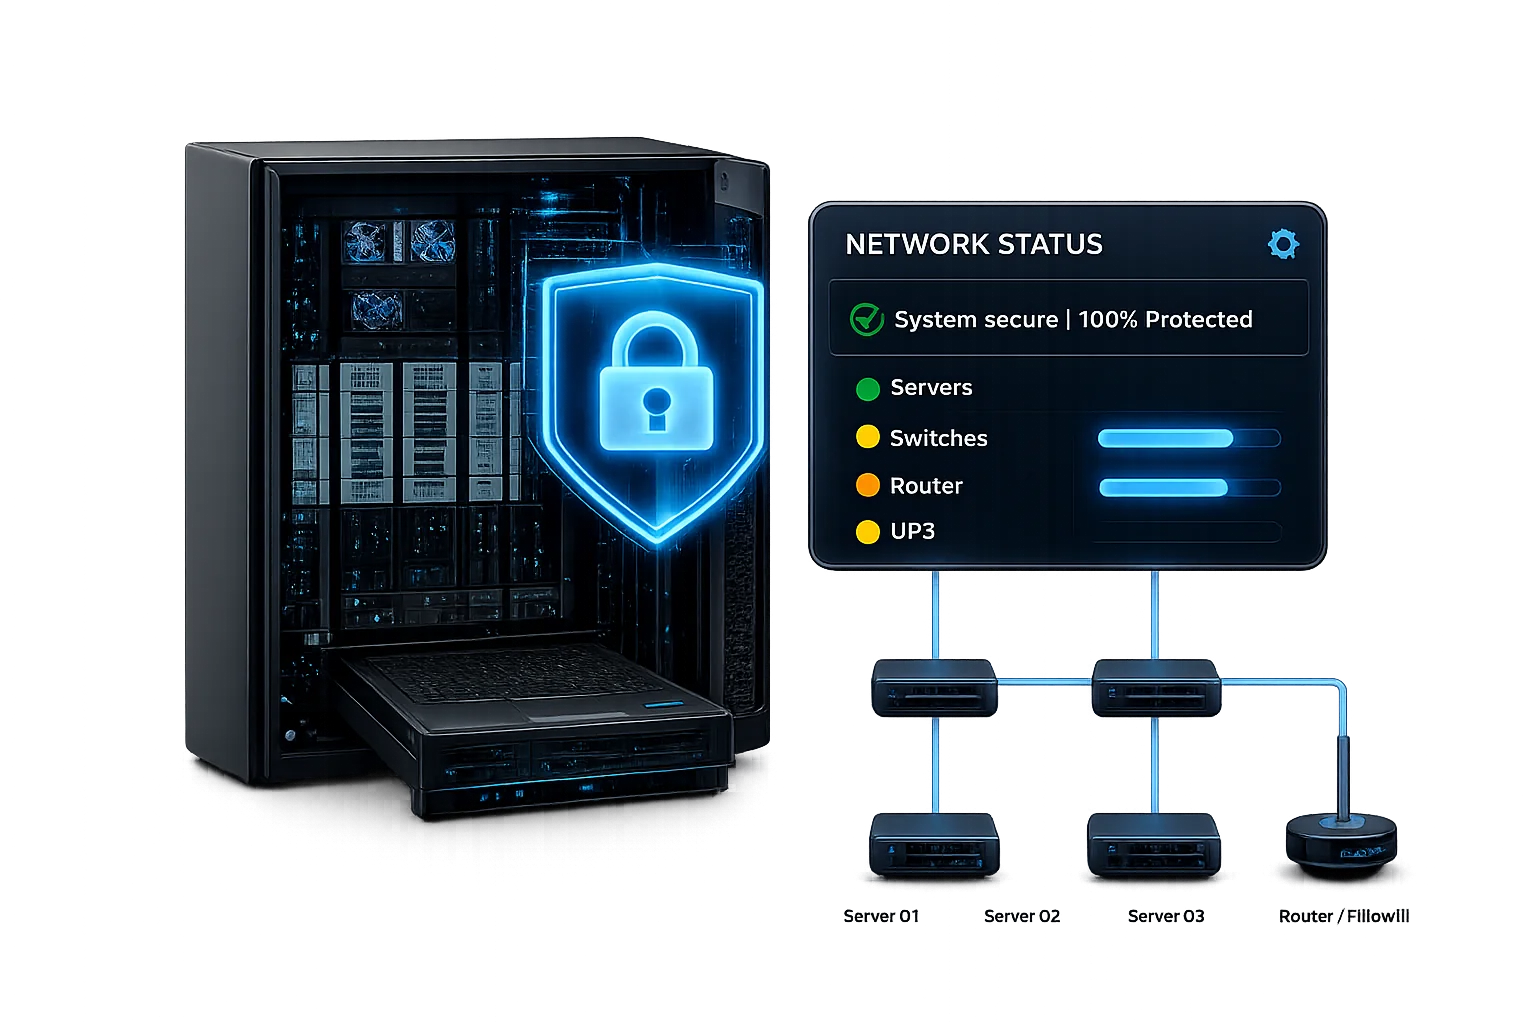
OT Cyber Audits
Independent testing of the ICS, SCADA, and building automation systems that keep your facility running, before an attacker finds the gaps.
Learn More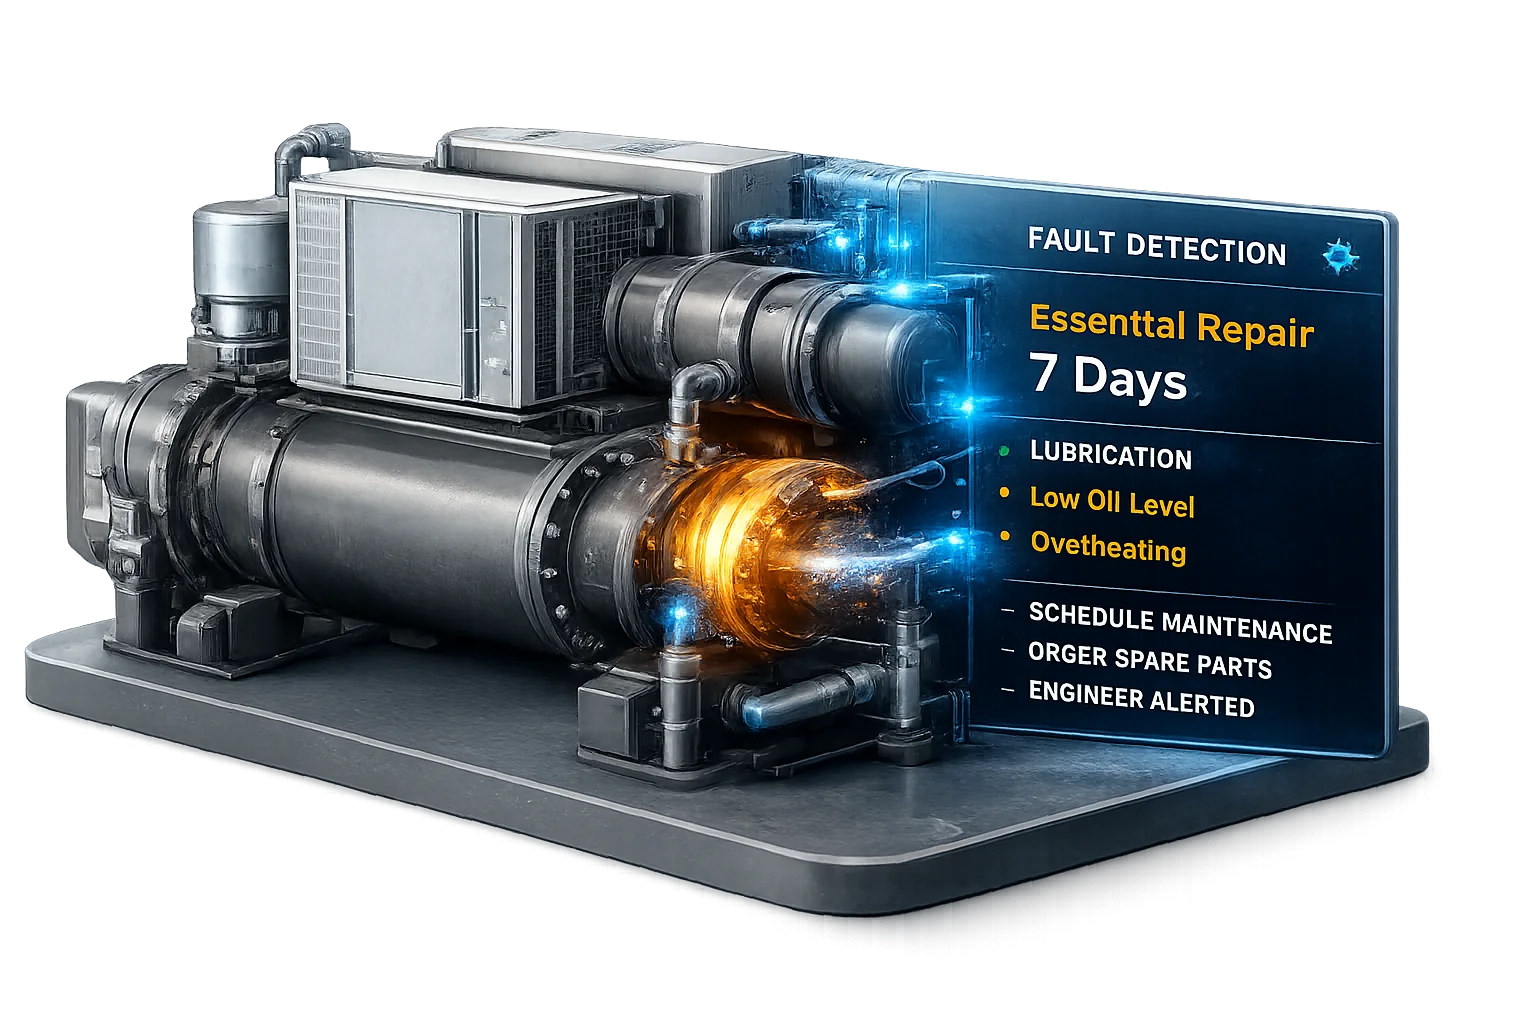
Automated Fault Detection
Machine learning and rule-based analytics that flag equipment faults and performance drift in real time, not after the fact.
Learn More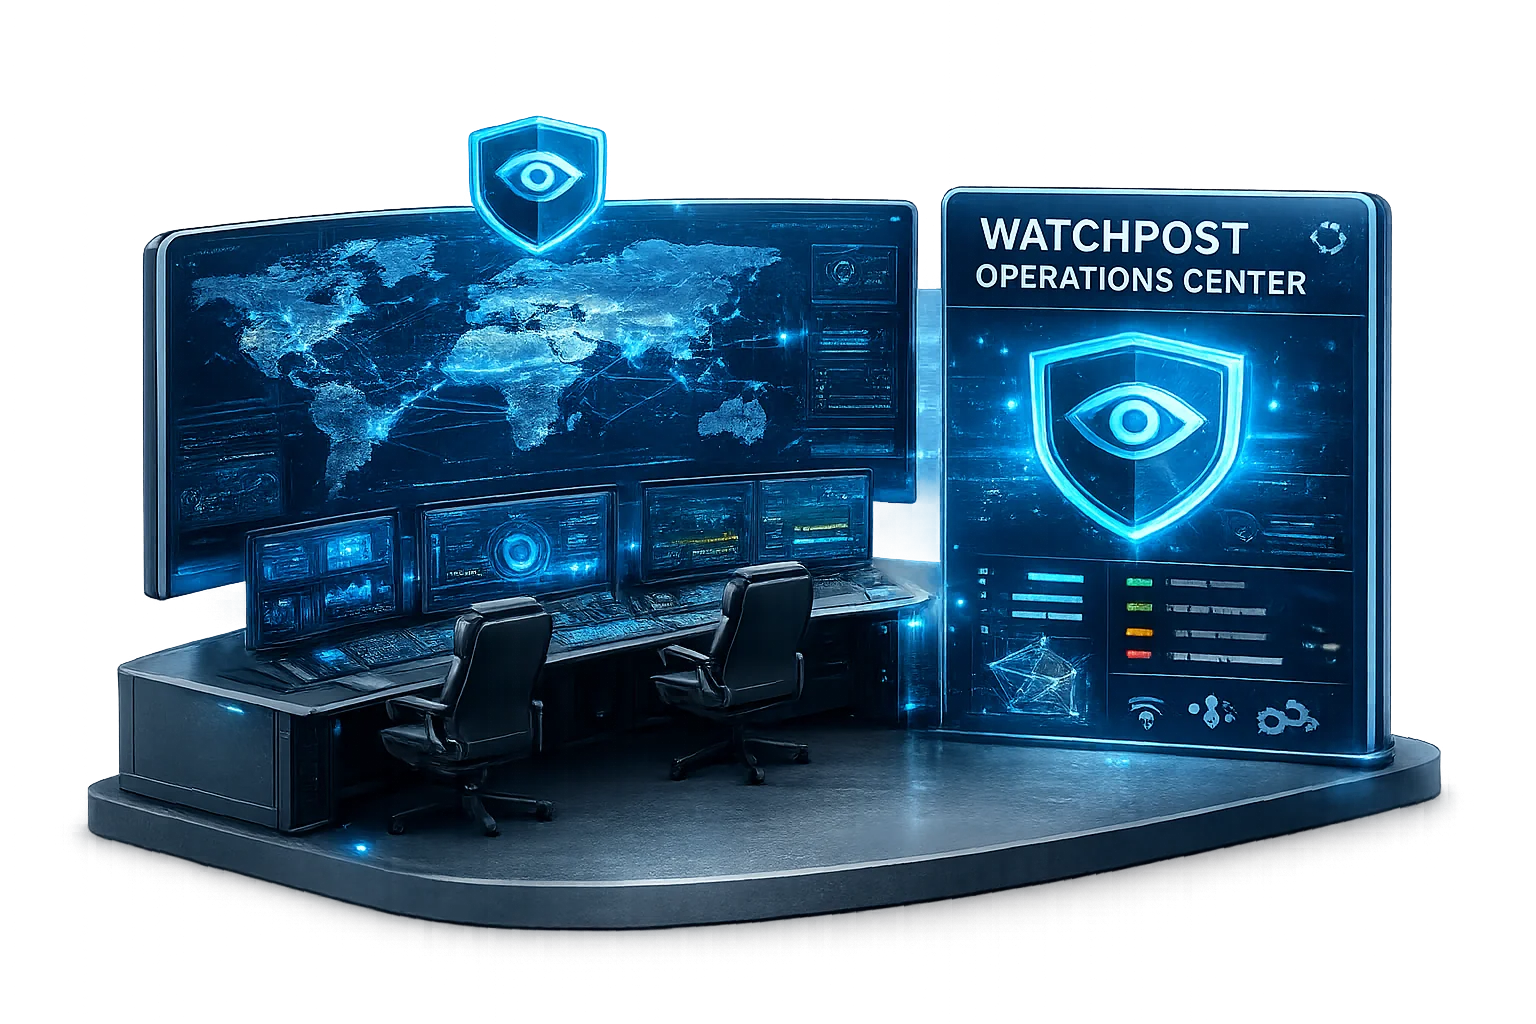
WatchPost Operations Center
A 24/7 monitoring service that watches server health, OS status, and PI System performance, with continuous vulnerability management built in.
Included with every deployment